
[ WAA Home | ProjeX Home | Download ProjeX | Help using ProjeX | ProjeX FAQ | About WAA]
So far all we have done is let everything default and generate an example Gantt chart, we have not produced anything to help us manage our own projects.
This example will generate a Gantt chart for a data processing project. The first step is to decide what tasks are relevant to our project and how they relate to each other. For this project let's define a new set of tasks (simply type over the cells were the previous ones were :
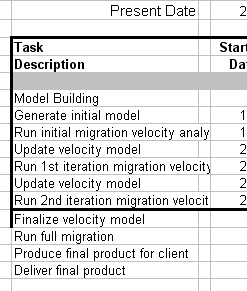
After moving cell contents around, cutting and pasting, and deleting things the format of the table looks a mess, for the moment let's not worry about that.
We now need to define the relationships between tasks and their durations. For this project each task is dependent on the task before being completed before it can begin so the default formula for the start date ("the end date of the task before plus one") can be used. This is just the default, the user can change the relationship between tasks (and even just specify the start date with no reference to another task). As we have added new tasks we need to copy this formula to the new rows. Select the last cell with the relationship (D17 in this example) and drag the formula down the rest of the start task cells. [We will go on to set the dependencies using ProjeX functionality later].
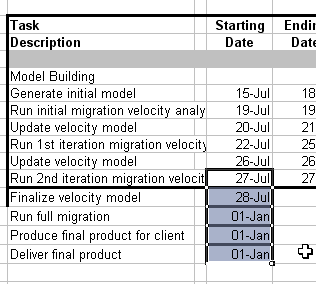
The format of the list is still messed up and the dates wrong because we have not defined the duration of each task and the formula for calculating the end of task for the new tasks. To get the end of task formula, select the last end date cell that has the formula set (E17 in this case) and drag it down the remaining cells. We can now edit the durations of each tasks so they are realistic.
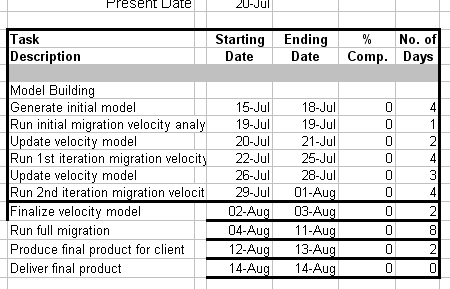
Let us set the start date of the project to something realistic by changing the start date of the first task and we are ready to generate a Gantt chart - our proposed schedule for the project.
There are three ways of generating a Gantt chart, the first produces the Gantt chart on the same sheet the task list is in, the second generates the chart on a separate sheet.
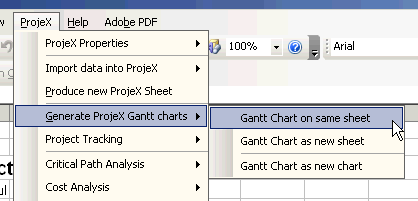
For this example we will generate the chart on a separate sheet and call it 'Initial Proposal', this way we have a permanent copy to compare with the actual progress of the project.
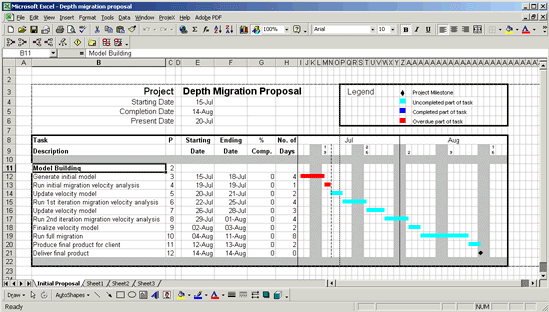
As before, as soon as we generate the Gantt chart a new 'P' column is added, ProjeX uses this unique number to identify the task and its properties.