There are three option under "Generate ProjeX Gantt chart" to generate the charts :
The first option attaches the generated Gantt chart to the side of the existing task sheet :
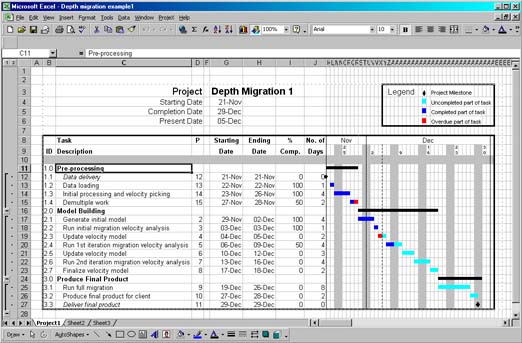
The second option produces the same sheet layout but on a separate Excel sheet. This way the user can keep track of a project as it develops.
The completed part of a task is colored dark blue, an overdue task colored red, a task not overdue as light blue, and a milestone as a black diamond.
Separate projects can be copied or linked to other ProjeX sheets to allow detailed Gantt charts for a group or department to be constructed. There is no limit to the number of ProjeX sheets per workbook.
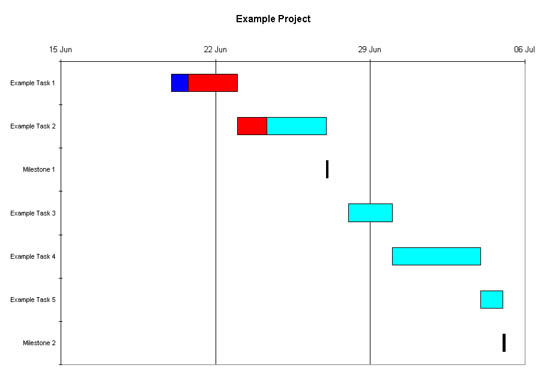
The third option produces an Excel chart as a separate ‘sheet’. This option generates the chart faster than the sheet approach but is limited by the what can be displayed as an Excel chart.
Separate projects can be copied or linked to other ProjeX sheets to allow detailed Gantt charts for a group or department to be constructed. There is no limit to the number of ProjeX sheets per workbook but it is suggested the user keeps to one per workbook and then uses Excel’s ‘Paste Special’ to produce composite task lists and Gantt charts.