
[ WAA Home | ProjeX Home | Download ProjeX | Help using ProjeX | ProjeX FAQ | About WAA]
Getting started with ProjeX
Once ProjeX is installed correctly its entry appears in Excel's menu bar. If you position the mouse over the entry the menu list show below appears.
ProjeX requires the tasks and dates to be arranged in a specific way and also sets up a number of temporary sheets that are used to store information on the tasks (their dependencies, work hours/days, etc) so initially we need to generate a new ProjeX sheet by selecting that option from the menu. Please note this does overwrite whatever is on the current worksheet [all data on the sheet will be deleted].
This brings up the following dialog:
There are two ways of generating the starting project sheet. The first (only option available with the freeware version) generates a simple example worksheet showing a group title, some example tasks and milestones ready to generate a Gantt chart with no changes. The other option lets the user specify the number of tasks to include initially when generating the ProjeX sheet (more can be added later of course).
The other major decision at this stage is whether we want to define our tasks by a starting date and duration (ProjeX calculating the ending date) or by starting and ending dates (ProjeX calculating the duration). This can be changed later using the 'Task definition' option selected using the right mouse button.
For more information on what the various options on this dialog do follow this link but for this example let them default.
The next dialog that appears is called the 'Display Properties' dialog and lets the user to set and manipulate a variety of options relating to how the Gantt charts are displayed. This is where the user can set the time axis display to say weeks rather than days (the default), note - for the freeware version only the 'Days' axis is available. One thing that should be mentioned here, ProjeX uses one sheet cell for whatever the time axis is set to, eg. if you are using 'Days' then each cell represents a day. Excel has a limitation of 256 columns per sheet, this means for the day axis you can only display around 240 days. If you want to display a year or more you must switch to the weekly axis (ProjeX will do this for you automatically).
We now have a number of tasks, milestones and a group heading set out as ProjeX requires. A group heading is defined for ProjeX as not having a starting date, a milestone as having a duration of 0 (if tasks are defined as start and duration) or a blank ending date (if tasks are defined as starting and ending dates). Note that the project title is the text entered in the Warning dialog (this can of course be changed by the user), the project starting and ending dates along with the present date are set by ProjeX and should not be manually edited by the user.
The task descriptions can be edited in the normal fashion for Excel, with tasks being inserted or added to the bottom of the list as required using Excels standard ‘Insert’ functionality. The starting and ending dates must be consistent with the number of days the task is scheduled to last. Note that a straight difference between the starting date and ending date does not give the total number of days, one needs to added. The percentage completion for the task can be any number between 0 and 100. The project start and end dates at the top of the sheet are automatically generated from the task list along with the present date which is automatically updated. A milestone is defined as having a duration of 0 days.
Task titles can now be added to the list. All fields except the task description column must be left blank for ProjeX to recognize that it is a title. When the chart is produced, the titles will be displayed in bold for printing.
Having set up the ProjeX sheet we can now generate generate a Gantt chart. There are three option under "Generate ProjeX Gantt chart" to generate the charts :
The first option attaches the generated Gantt chart to the side of the existing task sheet :
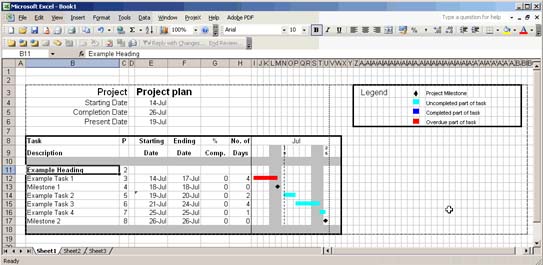
The overdue part of the task is colored in red, the remaining part in light blue and if there had been any part of the task completed it would be colored in dark blue with milestones show as black diamonds.
As well as the Gantt chart an extra column has now appeared with the title 'P', this is called the pointer column. ProjeX assigns a unique number to each task or group so that it can keep track of dependencies and the task's properties. This number should not be edited or duplicated by the user - ProjeX will get confused! If you cut and paste blocks of tasks remember to remove the duplicate pointer numbers, ProjeX will set new ones.
The above is covered in more detail on our examples page.
The second option produces the same sheet layout but on a separate Excel sheet. This way the user can keep track of a project as it develops.
The completed part of a task is colored dark blue, an overdue task colored red, a task not overdue as light blue, and a milestone as a black diamond.
Separate projects can be copied or linked to other ProjeX sheets to allow detailed Gantt charts for a group or department to be constructed. There is no limit to the number of ProjeX sheets per workbook.
The third option produces an Excel chart as a separate ‘sheet’. This option generates the chart faster than the sheet approach but is limited by the what can be displayed as an Excel chart.
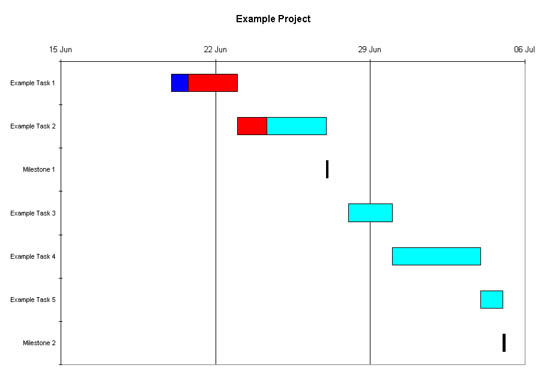
Please note, many of ProjeX's newer features are not available with this chart display. ProjeX is primarily designed to display on an Excel sheet not a chart.
Separate projects can be copied or linked to other ProjeX sheets to allow detailed Gantt charts for a group or department to be constructed. There is no limit to the number of ProjeX sheets per workbook but it is suggested the user keeps to one per workbook and then uses Excel’s ‘Paste Special’ to produce composite task lists and Gantt charts.