[ WAA Home | ProjeX Home | Download ProjeX | Help using ProjeX | ProjeX FAQ | About WAA]
Will Overwrite Options
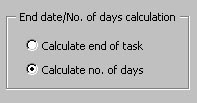 |
There are two ways for
ProjeX to represent tasks
|
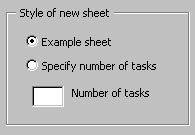 |
There are two ways for ProjeX to
generate a new sheet
|
 |
This is the name that will appear on the sheet [can be edited later]. |
| This option is useful for inexperienced users of ProjeX. If selected the cells that the user should change are shaded blue and those that are automatically calculated are shaded grey. | |
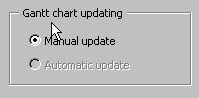 |
Currently every time tasks are updated the user must regenerate the Gantt chart for the chart to be updated. In future there will be an option to automatically update the chart. |