
[ WAA Home | ProjeX Home | Download ProjeX | Help using ProjeX | ProjeX FAQ | About WAA]
Gantt charts with Monthly time axis
The monthly axis for Gantt charts is useful to display large project that run over several years.
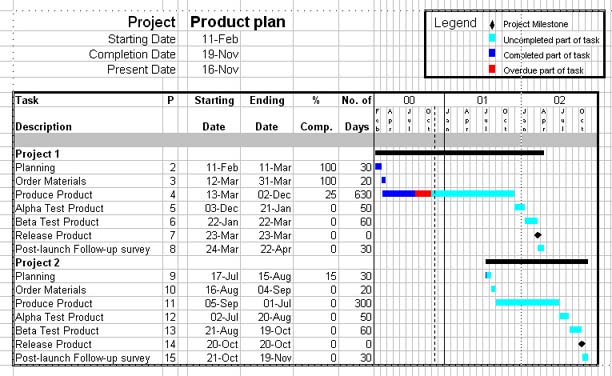
The plot above also has the 'group plot' option (under Display Properties dialog) switched on to show the overall duration of each group of tasks.